

Employment by Industry
The economy created 228,000 jobs in November, much higher than the year to date monthly average of 173,000. The total number of seasonally adjusted (SA), non-farm people employed in the U.S. in November was 147.241 million (M), an increase of 0.16% month on month, (m/m). Over the past 12 months the U.S. economy has added 2.071M. This was a +1.4% year on year, (y/y) increase.
The headline, (U3) SA unemployment rate was unchanged at to 4.1% in November as the number of unemployed persons was essentially unchanged at 6.6 million. Over the year, the unemployment rate and the number of unemployed persons were down by 0.5 percentage point and 799,000, respectively. The SA, U6 unemployment rate, (includes discouraged and other marginally attached workers plus part-time workers that would prefer to work full time) moved up 0.1 percentage point to 8.0%.
The SA service providing sector employed 127.042M people in November, up 166,000 jobs, 0.13% m/m and 1.634M, 1.3% y/y. Service providing employment in November accounting for 86.3% of the non-farm workforce. The big employers were education with 23.3M, government with 22.3M, retail with 15.8M, leisure and hospitality with 16.0M and financial services with 8.5M.
The SA goods producing sector employed 20.128M people in November, up 63,000, (+0.31%), m/m and up by 437,000 or 2.2% y/y.
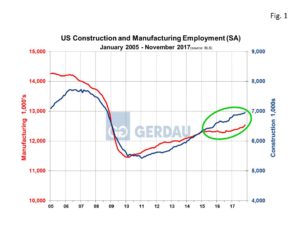 Figure 1 shows manufacturing and construction employment on the same chart from 2005 to present. Both manufacturing and construction employment are showing growth, construction is growing at a faster rate on a percentage basis.
The SA manufacturing sector employed 12.541M in November, up 5,800 or 0.46%, m/m and higher by 216,000 (1.8%), y/y. The two largest employment categories within manufacturing are motor vehicles and parts and transportation equipment. There were 940,100 employed in the manufacture of motor vehicles and parts, up 2,000 m/m, +0.18%. On a y/y measure, jobs in this sector were lower by 1,000 or 0.15%. The transportation equipment field employed 1.616M. Jobs in this sector were up by 3,000, +0.16% m/m but were down by 6,000, -0.35% y/y.
The construction sector employment a total of 6.955M, up 24,000, (0.35%), m/m and up by 184,000, (2.7%), y/y. Most construction workers are employed constructing buildings. In November there were 1.543M workers constructing buildings, up 9,000, 0.56% m/m and up 39,000, 2.6% y/y. Heavy civil engineering was the next largest construction segment employing 953,100 in November, down 8,000, -0.81% m/m but higher by 10,000, 1.0% y/y. Highway, streets and bridge construction employed 370,500, up 27,800, 8.1% and higher by 1,000, 0.3% y/y. Industrial building construction employed 177,100, higher by 2,400, +1.4% m/m and stronger by 1,100, +0.7% y/y. Commercial building construction jobs declined by 6,200 m/m, -1.0% to 605,700 workers m/m. On a y/y basis commercial construction jobs increased by 1,000, a 0.2% gain.
Figure 2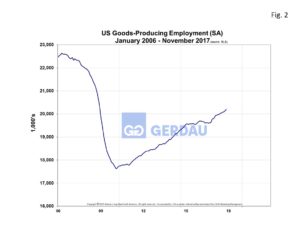 , show the history of “goods producing” employment from 2006 to present. Goods producing employment peaked at 22.6M in April 2006 then fell sharply as the recession took hold bottoming out at 17.6M, a decline of some 5M jobs. Since then employment has rebounded to 20.2M and is on pace to continue to add more workers. Keep in-mind that off-shoring as well as productivity enhancements, (robotics, information technology, etc.) replaced some of these positions.
At Gerdau, we keep a keen eye on the employment numbers, especially manufacturing and construction since this is where most long product steel ends-up. In addition we know that growth in net job creation correlates to increased steel consumption.