

Global Crude Steel Production and Capacity Utilization
Worldsteel Association (WSA) reports that global crude steel production totaled 141,046 million tonnes (Mt) at a capacity utilization rate (CUR) of 73.0% in June. This was 4.843 Mt greater than June 2016 at a 3.6 percentage point higher CUR than last years’ 69.4%.
On a three month moving average (3MMA), basis, the rate of annualized production was 1,692.6 million Mt. WSA estimates that current global capacity stands at 2,319 Mt, a decrease of 36,000 Mt y/y. Subtracting 1,692.6 from 2,319 = 626.4 Mt, which is the excess capacity in the world at current operating rates. To put this into perspective, the current raw steel production rate for North-America is 115.0 Mt, (626.4 / 115.0 = 5.45). The vast majority of this excess capacity (estimates range from 400 to 500 Mt), resides in China.
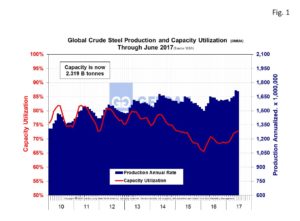 Figure 1 charts global steel production on the right-hand Y axis and percent CUR on the left-hand Y axis from 2010 to present. This current three month moving average, (3MMA) rate of annualized production was 1,705.9 Mt at a 3MMA CUR of 72.8%. Capacity utilization is trending up since its recent bottom of 65.6% in November 2016. The global CUR averaged 65.8% in 2016. Year to date 2017, the average CUR has increased to 71.0%, a significant 5.2 percentage point increase. This suggests that the global economy is in much stronger in 2017 than it was in 2016. Despite the welcome increase in the CUR, much work remains to eliminate excess capacity on a global basis.
Figure 2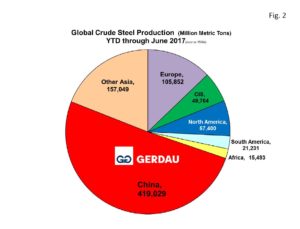 shows a pie chart of raw steel production by region year to date (YTD), through June 2017. China with 419,029 Mt represents more than half, (50.2%), of the total global raw steel output. The next biggest slice is “other Asia” with 157,049 Mt or 18.8% of the global total. Countries in “other Asia” include: India, Japan, South Korea, Pakistan, Taiwan, Thailand and Vietnam. Thus “total Asia” produces 69.0% of the world’s steel.
The Europe (EU27), was the next largest producing region YTD with 105,852 Mt, representing 12.7%. The CIS countries (Byelorussia, Kazakhstan, Moldova, Russia, Ukraine and Uzbekistan) combined tonnage was 49,704 Mt YTD for 6.0%. South America accounted for 21,231 Mt, (2.5%) and Africa for 15,493 Mt, (1.9%). North America (which includes Canada, US and Mexico as well as Cuba, El Salvador, Guatemala, Trinidad & Tobago), produced a combined 57,400 Mt. North Americas’ share of global output is declining. In 2006 North Americas’ share was 10.8%. By 2012, North Americas’ share was down to 8.0%. Year to date through June 2017, North Americas’ share stands at 6.9% of global raw steel output.
The Worldsteel Association’s short range outlook projects that 2017 crude steel production will increase by 1.3% to 1,535.2 Mt y/y. It predicts a 2.2% increase for the NAFTA region to 135.2 Mt of which should put U.S. volume at approximately 79.5 Mt.
At Gerdau we keep a keen eye on Global crude steel production and capacity utilization because of its huge impact on global trade and its influence on domestic pricing.