

U.S. Housing Inventory and Prices
Housing inventory of existing homes was 4.2 months’ supply in May. It was 4.6 months for new houses. This is a low number by historic standards. Low supply coupled with low interest rates results in higher prices. A total of 610,000 homes changed hands in May.
According to Census Bureau data, the national average price of home sales including land rose 16.1% year on year (y/y), to $406,400 in May, (the median price was $345,800). This was the largest y/y increase since September 2015. Since 2012, there have been 55 months with y/y price increase and just 10 months with y/y declines. Existing home sales averaged $294,600 in May, up 4.9% y/y. Total existing-home sales (includes single-family homes, townhomes, condominiums and co-ops), climbed 1.1% to a seasonally adjusted annual (SAAR), rate of 5.62M in May, up from 5.56M in April, an increase of 2.7% on a y/y basis.
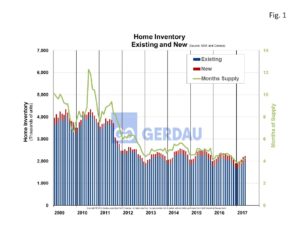 Figure 1 shows inventory of new and existing houses from 2009 to present. Properties were on the market for 27 days in May, down from 29 days in April and 32 days a year ago; this is the shortest timeframe since the National Association of Realtors (NAR), began tracking in May 2011. According to NAR, First-time buyers were a third of sales in May, which is down from 34% in April but up from 30% a year ago.
Given the low inventory level and rising price combination, coupled with low interest rates and strong employment gains, new home construction numbers should accelerate going forward. May’s starts and permit report support this theory. The seasonally adjusted annual starts rate was 1,146,000, up 1.2% y/y and the permit rate was a slightly stronger 1,219,000 up 9.4% y/y. Both of these figures were based on a three month moving average.
Regionally existing home sales in the Northeast rose 6.8% to an annual rate of 780,000. In the Midwest existing home sales fell 5.9% to an annual rate of 1.28M. The South existing home sales moved-up by 2.2% to an annual rate of 2.34M, while the West witnessed a 3.4% increase to an annual rate of 1.22M.
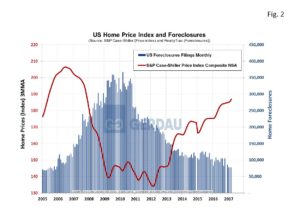 Figure 2 presents Case-Shuler home price index, from 2005 to present in both seasonally adjusted (SA), and non-seasonally adjusted (NSA), configurations on the left-hand Y axis and home foreclosure data on the right-hand Y axis. The chart shows that when foreclosures are as low as they were in the 2005 through 2007 period. The two data sets are near mirror images of one another. The May NSA Case-Shuler home price index score was 186.95, the highest value since November 2007. Distressed sales, foreclosures and short sales were 5% of sales in May, (4% foreclosures & 1% short sales), unchanged from April and down from 6% a year ago.
At Gerdau, we monitor the US housing market because historically new home construction has preceded non-residential construction (NRC), and therefore is an excellent barometer to foresee future demand for NRC.