

U.S. Reinforcing Steel (Rebar) Final Imports
Rebar final imports to the US were down 10.3% year to date (YTD), year on year (y/y), and totaling 1,184,741 tons for the seven months ending July 2017. July rebar imports were 148,692 tons, 13.9% lower than the January to June average.
F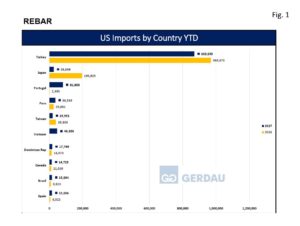 igure 1 charts the largest exporting countries in rank order on a YTD basis through July for both 2016 and 2017. Turkey is by far the largest exporter at 869,659 tons, down 10.3% YTD y/y. Turkish imports account for 73.4% of the total thus far in 2017, the same percentage as YTD 2016. July’s Turkish imports measured 65,036 tons down 48.5% from its January to June average of 134,104 tons.
Portugal was the second largest exporter with 81,803 tons YTD, up from just 2,490 tons YTD 2016. Portugal’s’ shipment volume is very erratic. It shipped zero tons in January, February and May, 16,033 tons in March, 1,478 tons in April, 35,118 tons in June and 29,174 tons July for a YTD average of 11,686 tons. Vietnam is a new entrant with 46,886 tons YTD, up from zero tons YTD 2016. Vietnam also exhibits an erratic export pattern. It shipped zero tons in January and June. Vietnam was back in July with 6,438 tons. Its YTD average through seven months was 6,698 tons.
Peru ranked fourth largest for rebar exports with a YTD total of 46,519 tons, up 41.1% y/y. Peru has only sent tons to the U.S. in February and June. Japan exported 26,634 tons, down 86.4% YTD y/y. Through July of last year, Japan had exported 195,825 tons of rebar to the U.S. YTD 2016. Japan has not exported any rebar tons since February of this year. Taiwan sent 19,991 tons of rebar to the U.S. through July of this year, 49.8% less than for the same period last year. Taiwan exported 9,558 tons in July, its third month YTD. Italy export tons totaled 18,042 YTD up from just 19 tons YTD 2016. Italy only shipments YTD 2017 were for 10,893 tons in June and 7,150 in July.
The 7th largest YTD exporter was the Dominican Republic with 17,749 tons, up 26.1% YTD y/y. July tonnage was 3,410 tons, 42.6% more than its January through June average. Brazil brought-in 15,894 tons of rebar to the U.S. market, an 80.1% YTD y/y increase. June, (5,553 tons) and July, (10,342 tons) were the only shipments for 2017. Spain’s rebar exports were also only for June, (818) and July, (15,068) YTD 2017. This was a 151% y/y increase over the same timeframe in 2016. Canadian ranked 10th, exported 14,728 tons YTD, a 33.7% y/y increase. July exports were 240 tons, well below the 2,414 ton January to June average.
There were 14 additional countries that exported rebar to the US thus far in 2017. The combined total was 15,226 tons or 1.3%. The 18 country total for July was 2,278 tons.
Houston/Galveston was the port that took in the most tons, 429,169, down 13.9% YTD y/y, followed by New Orleans offloading 218,745 tons YTD, flat YTD y/y. Philadelphia held the number three spot with 151,334 tons, gaining 24.3% YTD y/y. Miami was the next largest port bringing in 117,015 tons YTD, down 44.5% YTD y/y. Tampa saw a 132% YTD y/y increase receiving 58,155 tons. Boston was the sixth largest port YTD in 2017 bringing in 52,027 tons, up 78.9%, YTD y/y. San Juan PR took-in 47,020 tons, an increase of 22.0%, YTD y/y. Baltimore was next with 32,622 tons, surging 49.7% YTD y/y. San Francisco and Los Angeles ranked 9th and 10th with 30,417 tons, down 53.0% YTD y/y and 23,491 tons, down 65.2% YTD y/y respectfully.
Fifteen additional ports combined to offload 24,754 tons of rebar YTD 2017, 5.9% more than the 23,376 tons YTD 2016.
At Gerdau we closely follow trade in long products steel since it has a profound impact on domestic market share and material pricing. We want you, our valued customers to have access to current information that can help you better plan and operate your businesses.