

U.S. Steel Special Bar Quality Final Imports
SBQ final imports to the U.S. were up 23.8% year to date (YTD), year on year (y/y), and totaling 318,424 tons for the seven months ending July 2017. July SBQ imports came in at 46,666, 3.0% greater than the 45,293 ton January to June average volume.
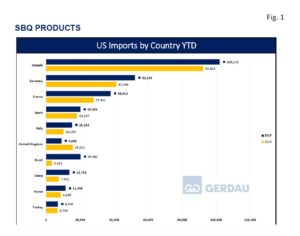 Figure 1 charts the largest exporting countries in rank order on a YTD basis through July for both 2016 and 2017. Canada was the largest exporter with 131,024 tons, up 12.1% YTD y/y. July’s volume at 16,228 tons, was 15.2% greater than its 19,133 ton January to June average volume. Germany sent 52,365 tons to the U.S. YTD, up 26.8% y/y. July exports were 7,075 tons, 6.2% lower than the 7,548 ton average through the first six months of the year. France ranked third YTD with 38,024, up 36.1% YTD y/y. For the month of July, French SBQ exports to the U.S. were 13,816 tons, more than three times its January to June average of 4,013 tons. Brazil sent 20,242 tons of SBQ to the U.S., surging 487% YTD y/y. July volume was 1,764 tons, down 42.7% compared to its 3,080 ton January to June average volume.
Spain exported 20,103 tons YTD, gaining 10.5% YTD y/y. July volume came in at 2,926 tons, 2.2% greater than its January to June average volume of 2,863 tons. Italy was the next largest with 15,253 tons, up 48.4% YTD y/y. Italian SBQ exports in July were 3,192 tons, 58.8% higher than its January to June average volume of 2,010 tons. China exported 13,758 tons of SBQ, up 82.9% YTD y/y. Volume for the July was 1,466 tons, down 28.4% from its 2,049 ton monthly average over the first six months of the year. Korea sent 11,468 tons of SBQ products to the U.S. YTD, up 3.0% y/y. Volume for the month of July fell to 921 tons, 47.6% below its January to June average of 1,758 tons. The United Kingdom’s YTD volume of SBQ exports to the U.S. was 9,033 tons, 42.2% less than YTD 2016. July’s exports were 1,856 tons, 55.2% greater than its January to June average of 1,196 tons. Turkey exported 6,970 tons of SBQ to the U.S. through July, up 3.0% y/y. Turkey sent 637 tons of SBQ bars to the U.S. in July, 39.6% less than its January to June average of 1,056 tons.
These top ten countries account for 90.9% of the total SBQ intake. There were 22 other countries that exported a combined 29,095 tons of SBQ YTD 2017.
SBQ is broken down into seventeen sub-categories, Table 1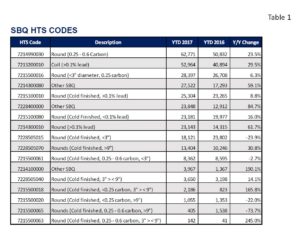 presents the breakdown by Harmonized Tariff Schedule, or HTS code in rank order by 2017 import volume. Rounds, (0.25 – 0.6 carbon) was the HTS code with the largest import volume YTD at 62,771 tons, up 23.5% YTD y/y. The next largest SBQ import HTS code was leaded coil with 52,964 tons, up 29.5% y/y. Rounds >3” was the third largest category with 28,397 tons YTD, up 6.3% YTD y/y.
Detroit was the largest receiving port, offloading 89,150 tons YTD, up 17.6% YTD y/y. Chicago held the number two spot with 42,381 tons, gaining 22.1% YTD y/y. Buffalo ranked third with 42,015 tons declining 1.3% YTD y/y. Houston/Galveston was the next largest port bringing in 26,722 tons YTD, an increase of 94.9% YTD y/y. New Orleans, received 24,533 tons, climbing 14.6% YTD y/y. Miami took-in 16,947, YTD y/y, up from just 632 YTD 2016. New York was the 7th largest receiver of U.S. SBQ with 12,731 tons, up 15.1% YTD y/y. St. Albans VT offloaded 11,499 tons, surging 41.8% YTD y/y. Savannah was next with 6,255 tons, tumbling 30.7% YTD y/y. Rounding-out the top 10 was Ogdensburg NY, bringing in 5,983 tons, off 14.1% YTD y/y.
Twenty-three additional ports combined to receive 42,346 tons of SBQ imports thus far in 2017, 13.3% of the total volume YTD.
At Gerdau we closely follow trade in long products steel since it has a profound impact on domestic market share and material pricing. We want you, our valued customers to have access to current information that can help you better plan and operate your businesses.