

Market Update
May 2017
The IP index recorded a value of 105.10 in April, up 1.0% month on month (m/m) and by 1.2% year on year (y/y). April’s score exceeded analysts’ expectations and was the third month in a row with a positive m/m gain. The increasing trend is welcome news for manufacturing.
April 2017

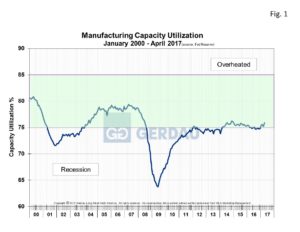
The manufacturing index moved up for the third consecutive month reaching 75.3897 in February. This places in just inside the desirable range of between 75 and 85. Greater than 85 is considered to be overheated, while less than 75 is in the recessionary zone.

The US Census Bureau reported that new orders for manufactured goods increased $4.8 billion (B), or 1.0% to $476.5 B in February. This was the seventh increase in the past eight months and follows a 1.5% increase in January.
March 2017

The overall Industrial Production (IP) index was flat both month on month and year on year in January. The index for manufacturing output rose 0.2% in January. However, the production of motor vehicles and parts decreased 2.9% while other manufacturing production manufacturing increased by 0.5%.
January 2017

This data is from the Federal Reserve and is seasonally adjusted. The index is based on the May 2012 level being defined as 100.