

View Block
Market Update
View Block
November 2025
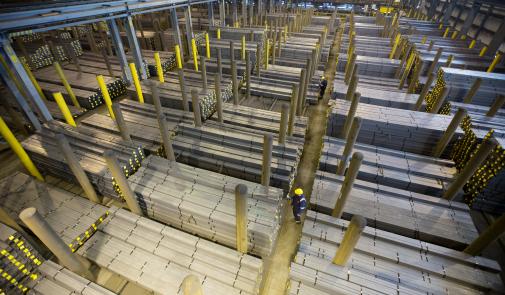
U.S. Steel Capacity Utilization:
For the week ending November 15th, total raw steel production was 1.745 million net tons, with a capacity utilization rate of 76.2%.
Year-to-date output reached 79.421 million net tons, averaging 76.7% capacity utilization. In comparison, during the same period in 2024, output totaled 78.530 million net tons at an average utilization rate of 76.9%.
U.S. Steel Capacity Utilization: For the week ending October 31, total raw steel production was 1.747 million net tons, with a capacity utilization rate of 76.3%.
September 2025
U.S. Steel Capacity Utilization:
The total tonnage for the week ending September 27th was 1,770 million net tons, at a capacity utilization rate of 78.1%. The year-to-date tonnage output is 67,216 million net tons, at an average capacity utilization rate of 76.7%. In 2024, the same output total was 67,112 million net tons, at an average capacity utilization of 77.5%.
U.S. Steel Capacity Utilization: The total tonnage for the week ending September 20th was 1,754 million net tons, at a capacity utilization rate of 76.7%.
U.S. Steel Capacity Utilization: The total tonnage for the week ending September 13th was 1,764 million net tons, at a capacity utilization rate of 77.9%.

U.S. Steel Rebar Final Imports: Final Rebar Imports to the U.S. came in at 67,071 tons for the month of July 2025, down 51.8% m/m.