U.S. Steel Rebar Final Imports
U.S. Steel Rebar Final Imports:
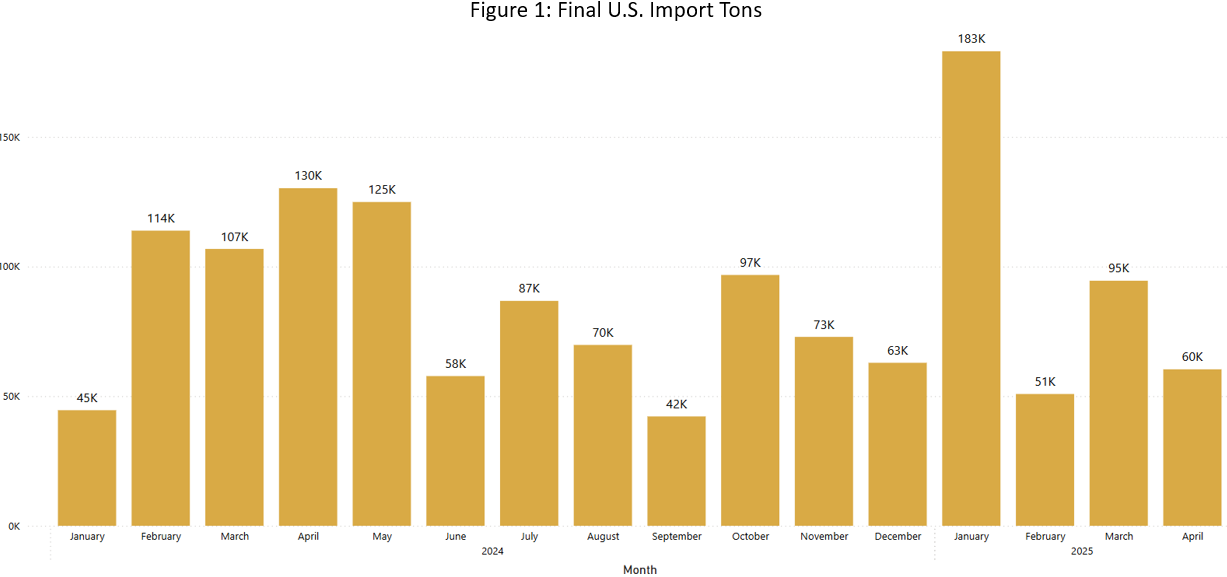
Final Rebar Imports to the U.S. came in at 60,358 tons for the month of April 2025, down 36% m/m. Rebar imports include: concrete reinforcing bars and rods of iron or non-alloy steel, irregularly wound coils hot-rolled, concrete reinforcing bars and rods of other alloy steel, not further worked than hot-rolled, hot-drawn or extruded, and other bars and rods of iron or non-alloy steel, hot-worked, concrete reinforcing bars and rods.
Figure 1 further breaks down total rebar imports through April 2025.
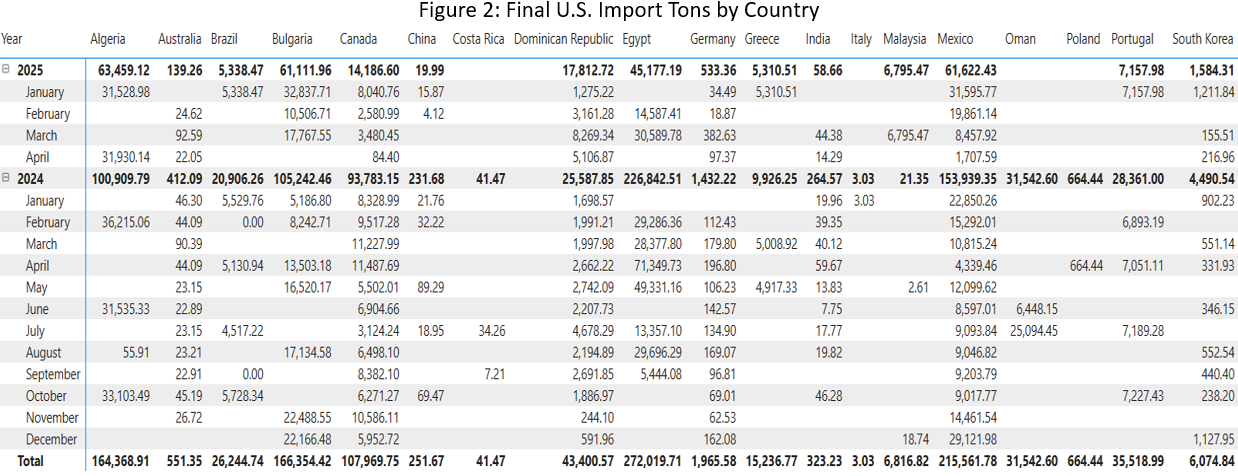
Figure 2 charts the largest exporting countries to the U.S. in rank order through April. Algeria was the largest exporter of rebar with 31,930 tons this month (53%). Vietnam was the second-largest exporter with 21,169 tons. Dominican Republic was the third-largest rebar exporter with 5,106 tons. Together, these three exporters accounted for 96% of the total.
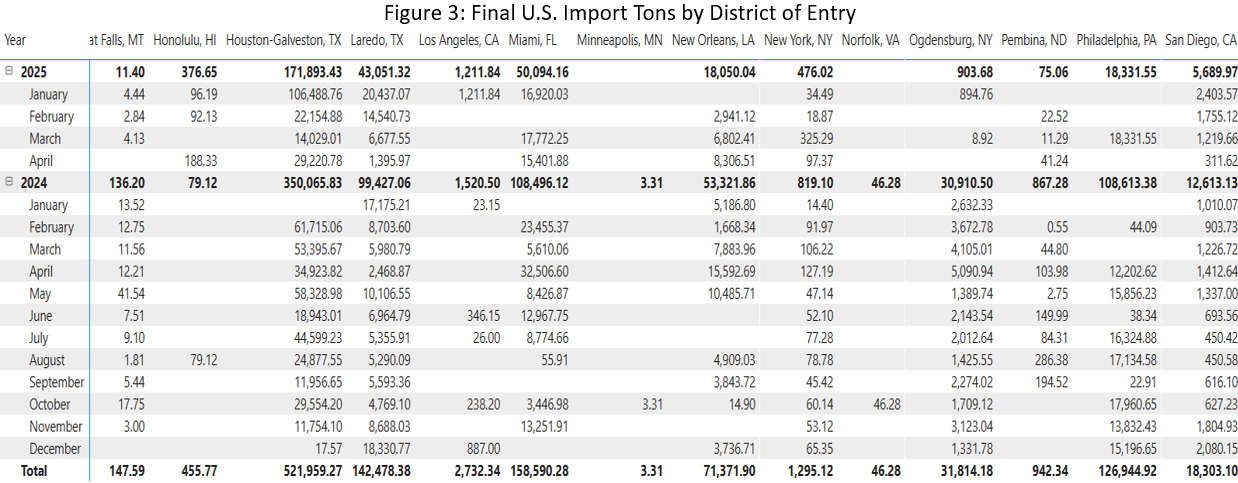
Figure 3 also charts the largest imports by district of entry to the U.S. in rank order. The Houston-Galveston, TX port was the largest receiver of rebar this month, receiving 29,220 tons. Miami, FL was the second-largest receiver coming in at 15,401 tons. New Orleans, LA was the third-largest receiving port with 8,306 tons. Together, these three ports collected 88% of total rebar imports in April.
Please note the format of Figure 2 and Figure 3 has changed. Countries are listed alphabetically left to right and month/year is on the y-axis. There are listed totals YTD for each country and district of entry, respectively.
At Gerdau, we closely follow trade in long product steel since it has a profound impact on domestic market share and material pricing. We want you, our valued customers, to have access to current information that can help you better plan and operate your businesses.