

Global Crude Steel Production and Capacity Utilization
Worldsteel Association (WSA) reports that global crude steel production totaled 148.33 million tonnes (Mt) at a capacity utilization rate, (CUR) of 74.5% in March. Production was down by 15.944 Mt month on month but the CUR was up 0.9 percentage points over February.
WSA reports that on a year on year, (y/y) comparison, global crude steel production in March increased by 5.65 Mt as the CUR rose 1.5 percentage points.
The World Steel Association (worldsteel) currently collects crude steel production data from 64 countries. These countries accounted for approximately 99% of total world crude steel production in 2017. Worldsteel collects blast furnace iron production (BFI) from 38 countries. These 38 countries accounted for approximately 99% of total world blast furnace iron production in 2016. Fourteen countries also report their direct reduced iron production (DRI) production on a monthly basis. These 14 countries accounted for approximately 85 % of total world direct reduced iron production in 2016 (2017 data is not yet available).
On a three month moving average, (3MMA) basis the rate of annualized production rate through March was 1,700.8 Mt. WSA estimates that current global capacity stands at 2,389 Mt, thus, the annual excess global capacity at current operating rates is approximately 688.2 Mt Data for February reports that excess capacity was 500.9 Mt, thus 187 Mt was gained over a one month period.
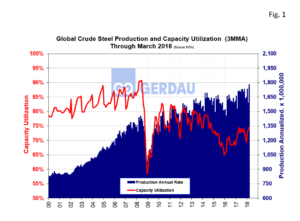 Figure 1 charts global steel production from 2000 to present on the right-hand Y axis and percent CUR on the left-hand Y axis. Capacity utilization increased as production is falling supporting the notion that a lot of production capacity has been jettisoned.
Figure 2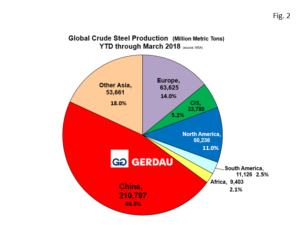 shows a pie chart of raw steel production by region YTD, through March 2018. China with 210,797 Mt YTD, +5.0% y/y, accounts for close to half, (46.3 %) of global steel production. China’s share has been falling over the last two months compared to 2017. For all of 2017, China’s share was 50.1%
The next biggest slice was “other Asia” with 53,661 Mt, +3.7% y/y, and accounting for 18.0% of the global total. Countries in “other Asia” include: India, Japan, South Korea, Pakistan, Taiwan, Thailand and Vietnam. Adding China + other Asia, accounts for 64.3% of global steel output.
The Europe Union was the next largest producing region YTD with 63,625 Mt, +22.0% y/y and accounting for 14.0% of the global total.
North America (which includes Canada, U.S. and Mexico as well as Cuba, El Salvador, Guatemala, Trinidad & Tobago), produced a combined 50,236 Mt, 73.6% y/y, accounting for 11.0% of global output.
The CIS countries (Byelorussia, Kazakhstan, Moldova, Russia, Ukraine and Uzbekistan) combined tonnage was 23,780 Mt YTD, -5.7% y/y, representing for 5.2% of the global total. South America accounted for 11,126 Mt, up 6.8% y/y, accounting for 2.5% of the global total. Africa’s tonnage YTD was 9,403, +24.4% y/y, it accounted 2.1% of the global total.
The Worldsteel Association’s website shows a chart of steel consumption on a global basis for the year 2015. This charts shows that 50% of all steel consumed in the world goes into buildings and infrastructure. The next largest consumer is mechanical equipment at 16%, followed by automobiles at 13%. Metal products account for 11%, while transportation other than autos for 5%. Electrical equipment consumes 3% and appliance use-up 2%. The chart also color codes consumption by service life, breaking these down to short, medium and long term service life.
At Gerdau we keep a keen eye on Global crude steel production and capacity utilization because of its huge impact on global trade and its influence on domestic pricing.