

Global Scrap Trade through Q2 2016
This data is not very current because some nations are slow to report but we still believe it gives a valuable perspective of global trends and is the foundation of where we are today. In this analysis we have excluded scrap that was traded within the EU from the global total. Figure 1 shows the total volume of ferrous scrap traded between nations since Q1 2000 and that Q1 2016 was the lowest since Q1 2006 then bounced back in Q2 of this year to 17.8 million tonnes. The tonnage of exports from the US has declined for five years.
[caption id="attachment_724" align="alignleft" width="500"]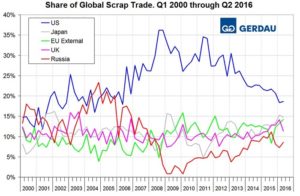 Figure 2[/caption]
Figure 2 shows the global market share of the five major players. These are the US, Japan, the EU, the UK and Russia. The US share peaked at 36.2% in the 3rd and 4th quarters of 2008, fell steadily to 18.3% in the 1st quarter of this year and recovered to 18.6% in the 2nd quarter. We attribute the long term US situation to both a decline in actual global commerce and the strengthening of the US $. The other four major players have maintained their share, in other words all of the global decline in total trade has been at the expense of the US. Turkey the largest scrap buyer has seen its share of total global purchases remain fairly constant at around 25% for the last 4 ½ years, Figure 3, but Turkey’s import tonnage has been on a downward trend for 3 ½ years as the global total has declined, Figure 4.
[caption id="attachment_729" align="alignright" width="500"]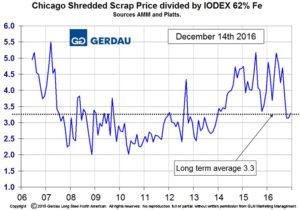 Figure 5[/caption]
Part of the reason why Turkish buys have declined is that they have been purchasing semi-finished billets and slabs from China in particular. Chinese semi-finished was lower cost than the Turkish EAF mills could produce themselves during the period mid-2014 through mid-2016 because iron ore was advantageously prices vs scrap and the Chinese producers are 93% BOF. As of December 2016 this situation has now corrected and the price ratio of scrap to ore is back to its long term average of 3.3 as shown in Figure 5. This has contributed to the recent strengthening of domestic scrap prices in the US. In the period 2010 through 3013 Turkey purchased a similar tonnage from the US as it did from the EU but as the Euro has declined in US dollar terms their scrap has become more attractive and in the 2nd Q of this year European shipments to Turkey surged, Figure 6.