

Oil and Gas Rotary Rig Counts
The total number of operating rigs in the US the week ending April 14th was 847, 683 oil and 162 gas. For both oil and gas this was 33% higher than after the BP Gulf explosion April 2010. Month on month oil rigs were up 8.2% and gas rigs were up 3.2%, for an overall increase of 7.4%.
On a year on year (y/y) comparison, oil rigs have almost doubled, up 94.6%. For gas the y/y increase was 82.0%. The combined figure was +92.5%.
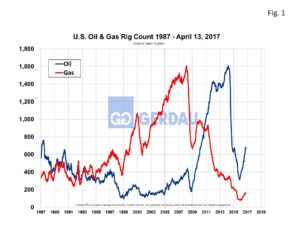 Figure 1 shows the Baker Hughes US Rotary Rig Counts for oil and gas equipment in the US through April 14th. US oil rig count trending sharply higher since the recent low of 316 units on May 27th. The gas rig count bottomed out at 81 on August 26th and has exactly doubled since then. Oil and gas prices are on the rise which is the key driver for the increase in rig counts.
Referencing Bloomberg Energy, Brent crude oil was $55.80 per barrel today (4/13/2017) up 27.3% from $43.84 per barrel last year. Similarly West Texas Intermediate (WTI) crude oil sold for $53.07 per barrel today, up 27.9% y/y. Natural gas increased the most in percentage term rising 57.5% y/y from $2.06 per MMBtu to $3.23 per MMBtu. This is good news for steel providers to the energy sector.
Baker Hughes reports the world rig count (including U.S. and Canada) is finally above 50 percent of what it was in 2014. The article goes on to explain that fewer rigs are required to pump the same quantity of oil than in days gone by because modern rigs have made advancements in “multiple stage completion systems”. In summary, more fracs using more sand equals more production. The point of the story being that, higher oil/gas prices no longer has a 1 to 1 relationship with more rigs and this technology is only in its infancy.
At Gerdau we monitor rig counts along with the price of oil and natural gas since it has a major impact on long product sales to include Special Bar Quality sucker rods for down hole pumping strings to merchant and structural products for rigs and oilfield equipment.