

Oil and Gas Rotary Rig Counts
Oil and Gas Rotary Rig Counts: The total number of operating rigs in the U.S. the week as of April 3rd was 563 oil and 100 gas (totaling 663). In percentage terms, on a month on month, (m/m) basis, oil rigs were down 17.6% and gas down 8.3%. On a year on year, (y/y) comparison, rigs were down 32.4% for oil and down 48.5% for gas. The combined figure for YoY was -35.2% or -361 rigs.
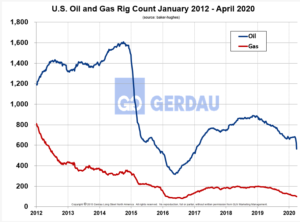
Figure 1 shows the Baker Hughes U.S. Rotary Rig Counts for oil and gas equipment in the U.S. from 2012 to present. Oil rigs rose have dropped below 1,000 rigs starting in 2015 and landing at 678 this week. Gas rigs bottomed-out at 81 in August 2016 then rose steadily topping out at 110 this week.
For the week ending April 3rd, Texas was operating 338 rigs (52.3% of the total), followed by New Mexico with 100, (15.5%), North Dakota with 42, (6.5%). Louisiana had 26 on-land and 18 off-shore, (6.8%). Oklahoma count was 29, (4.5%). These five states together account for 83.9% of the nation’s rig count.
The energy agency now expects oil demand growth to reach 1.1 million barrels per day in 2019 and 1.3 million bpd in 2020, CNBC reported. In its closely watched monthly oil report, the IEA said there was “growing evidence of an economic slowdown” with many large economies reporting weak gross domestic product growth in the first half of the year.
At Gerdau we monitor rig counts along with the price of oil and natural gas since it has a major impact on long product sales to include Special Bar Quality sucker rods for downhole pumping strings to merchant and structural products for rigs and oilfield equipment.