U.S. Fabricated Beam Final Imports
U.S. Fabricated Beam Final Imports:
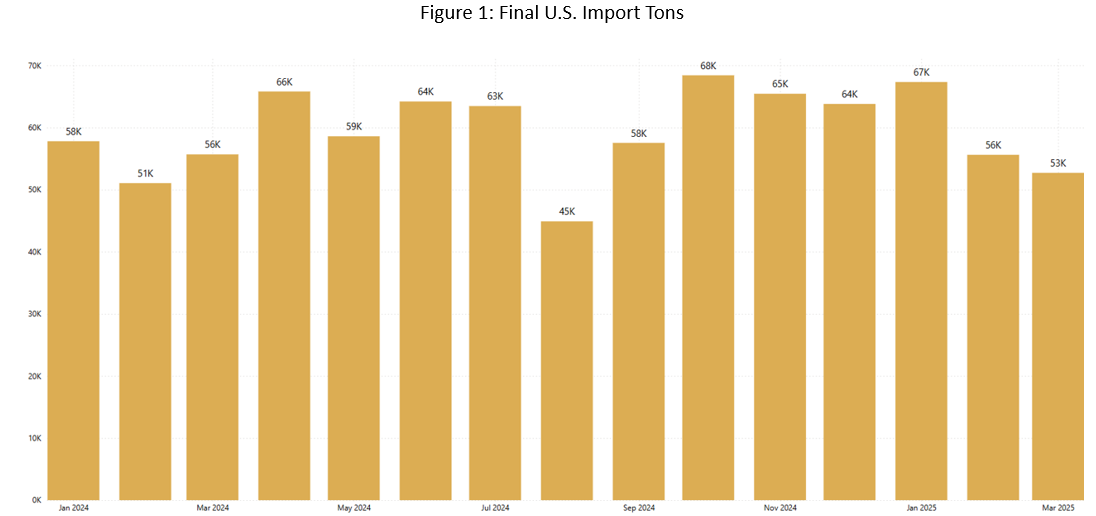
Final fabricated beam imports to the U.S. came in at 52,703 tons in March 2025, decreasing 5% month over month (m/m).
Figure 1 breaks down total fabricated beam imports from January 2024 – March 2025.
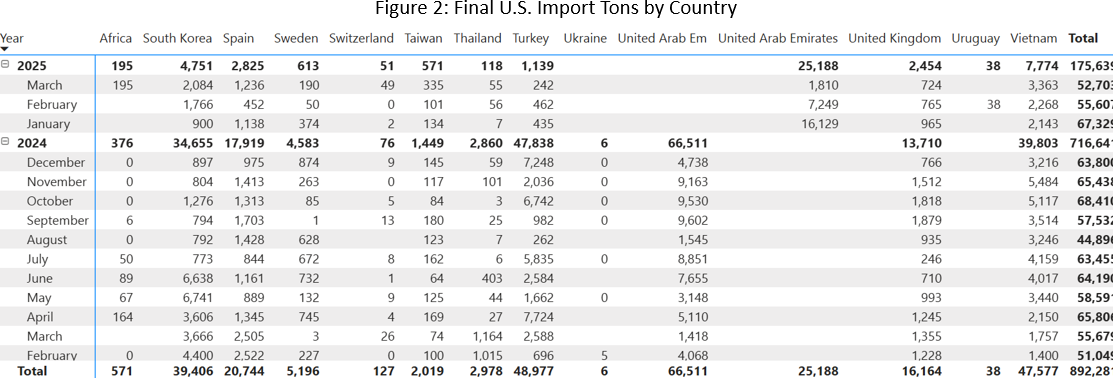
Figure 2 charts the largest exporting countries in rank order through July. Canada was the largest exporter of fabricated beams with 17,949 tons this month (34%). Mexico was the second-largest exporter with 11,328 tons. India was the third-largest exporter of fabricated beams to the U.S. with 6,735 tons. Together these three exporters accounted for 68% of total fabricated beam imports.
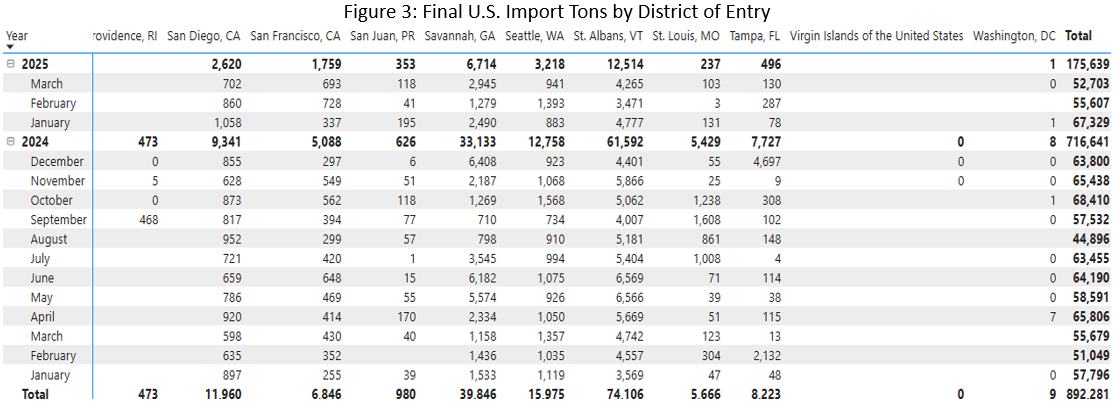
Figure 3 also charts the largest imports by district of entry to the U.S. in rank order. The Laredo, TX port was the largest receiver of fabricated beams this month, receiving 8,404 tons. Ogdensburg, NY was second, coming in at 7,040 tons. Houston-Galveston, TX was the third-highest receiver with 5,050 tons. Together, these three districts of entry accounted for 39% of total imports.
Please note the format of Figure 2 and Figure 3 has changed. Countries are listed alphabetically left to right and month/year is on the y-axis. There are listed totals YTD for each country and district of entry, respectively.
At Gerdau, we closely follow trade in long product steel since it has a profound impact on domestic market share and material pricing. We want you, our valued customers, to have access to current information that can help you better plan and operate your businesses.