

U.S. Fabricated Beams Final Imports

Figure 1 breaks down total final fabricated beam imports from January 2018 – October 2019. When comparing year to date figures from 2018 and 2019. Fabricated Beam final imports to the U.S. were down 8% YoY, and down 4% MoM in October 2019, coming in at 37,899 tons.
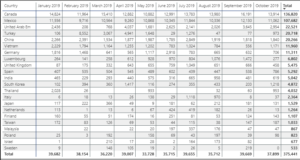
Figure 2 also charts the largest exporting countries in rank order for January – October 2019. Canada was the largest exporter of fabricated beams with 13,914 tons in October 2019. Mexico was the second largest exporter with 11,062 tons. United Arab Em was the third largest rebar exporter of fabricated beams to the US with 2,954. Together these three exporters accounted for 71% of the total fabricated beam imports.
Laredo, TX port was the largest receiver of U.S. fabricated beams in October 2019, receiving 8,085 tons. St. Albans, VT was the second largest district of entry receiver coming in at 7,003 tons. Ogdensburg, NY was the third highest receiver with 3,802 tons. Together these three districts of entry accounted for 47% of the total imports.
At Gerdau we closely follow trade in long products steel since it has a profound impact on domestic market share and material pricing. We want you, our valued customers to have access to current information that can help you better plan and operate your businesses.