U.S. Housing Inventory and Prices
Referencing Realtytrac, there were a total of 428,400 U.S. properties with foreclosure filings, default notices, scheduled auctions or bank repossessions in the first six months of 2017, down 20% from the same time period a year ago and down 28% from the same time period two years ago.
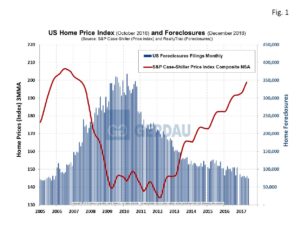
Figure 1 shows U.S. home foreclosure filings and the Case-Shiller non-seasonally-adjusted (NSA), price index from 2005 to present. Foreclosures are currently approaching the lows reached in the 2005 to 2006 time period. The price line is a near mirror image of foreclosures. Prices are approaching the all-time highs also reached during the 2005 to 2006 timeframe. The median price of existing homes including land (Source: U.S. Census Bureau), sold in June was $310,800 up 5.4% year on year (y/y). The average price of existing homes, including land sold in June was $379,500 up 4.2% year on year (y/y).
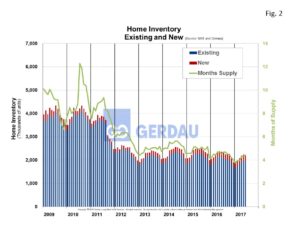
Housing inventory of existing homes was 4.3 months’ supply in June, down 4.4% y/y, but up 2.4% m/m. For new homes, the months’ inventory supply picture was 5.4 months, up 12.5% y/y and +1.9% m/m. Both of these inventory levels are low by historic standards. Low supply and low interest rates is pushing prices higher. On a seasonally adjusted annual rate (SAAR), a total of 610,000 homes changed hands in June in the U.S. Breaking this down to the four regions, the Southern region had over 50 percent of the total sale with 323,000. The West saw 180,000 homes change hands. The Midwest came-in at 66,000, while the Northeast had the fewest sales with 41,000. Figure 2 shows inventory of new and existing houses from 2009 to present.
According to the National Association of Realtors (NAR), Total existing-home sales decreased 1.8% to a SAAR of 5.52 million in June from 5.62 million in May. Despite the decline, the June sales pace is 0.7% above a year ago. Low supply is pushing prices above buyers’ budgets, as listings in the “affordable range” gets scooped up quickly. As a result, many would-be buyers are left on the sidelines. First-time buyers were 32% of sales in June, which is down one percentage point both m/m and y/y. Properties were on the market for an average of 28 days in June, up one day over May but down six days y/y as 54% of homes sold were on the market for less than a month. Quoting Lawrence Yun, NAR chief economist, "It's shaping up to be another year of below average sales to first-time buyers despite a healthy economy that continues to create jobs. Worsening supply and affordability conditions in many markets have unfortunately put a temporary hold on many aspiring buyers' dreams of owning a home this year."
At Gerdau, we monitor the US housing market because historically new home construction has preceded non-residential construction (NRC), and therefore is an excellent barometer to foresee future demand for NRC.

