

U.S. Housing Starts and Permits
On a three month moving average, (3MMA) basis, total housing starts were reported at a seasonally adjusted (SA), annual rate of 1,165,000 for the month of September, up by 20,000, 1.8% year on year, (y/y). Single family housing starts move-up sharply, while multi-family housing starts tumbled.
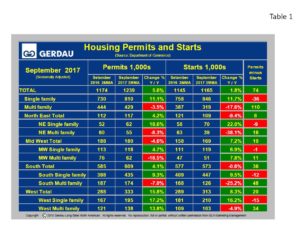 Table 1 breaks down starts and permit detail for SF and MF by region. All data references are three month moving averages y/y, (3MMA y/y), which helps smooth out spikes in single month data and therefore gives a more realistic viewpoint on the pulse of home building activity.
Nationally, SA, SF starts surged higher by 11.7% y/y, led by a 22.0% y/y jump in the Northeast and a 16.2% surge in the West. Elsewhere SF starts were up 9.5% in the South and higher by 6.9% in the Midwest..
Nationally, SA, MF starts plunged by 17.6%. Multi-family starts were lower y/y in three of the four regions led lower by a 38.1% plunge in the Northeast, and a 25.2% decline in the South. The West saw MF starts fall by 4.9%. Meanwhile MF starts in the Midwest were up 7.8% y/y.
Nationally, total SA annualized permits increased by 5.6%, 3MMA y/y to 1,239,000 units with SF permits up 11.1% and MF permits down 3.5%. Three of the four regions reported stronger growth in total building permits y/y led by a 15.8% surge in the West. The West’s permits were up 17.2% for SF and +13.8% for MF. The Northeast reported a 4.2% y/y rise in permits, a combination of a 18.6% y/y increase for SF and a negative 8.3% y/y for MF. The Midwest total permits were down 4.6% y/y, (SF +4.7%, MF -18.5%). The South posted overall permit growth of +4.1%, (SF +9.3%, MF -7.0%).
Permits gage future housing builds. The column on the far right in Table1 illustrates permits minus starts. For the nation as a whole permits minus starts = +74,000. This indicates that housing construction will rise in the coming months.
Figure 1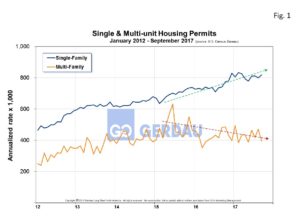 shows SA housing permits history from 2012 to present. Single family is growing at a steady rate but still remains very low by historic standards. Recently multi-family starts have plateaued and begun to decline. Relative to history, multi-family starts are higher than during the pre-recession time-period.
Figure 2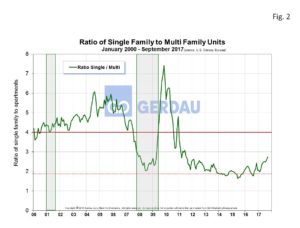 illustrates the ratio of SF to MF from 2000 to present. Pre-recession the ratio of SF:MF was in the 5:1 to 6:1 range. This ratio plummeted after the recession as demand shifted towards apartments. The ratio fell below 2:1 throughout most of 2014 and 2015 and is now trending higher, reaching 2.75:1 in September. The ratio has been trending higher over the past year.
This shift means that consumers are gaining confidence in the strength of the economy and are more willing to take the plunge into purchasing a SF house. In addition to a higher consumer confidence level, the National Association of Home Builders, (NAHB) reported a score of 68, (>50 indicates a favorable outlook) on its Housing Market Index. The combination of tight inventory of existing homes and promising growth in new household formation is driving the higher score. The NAHB expects the new home market to continue to strengthen at a modest rate for the foreseeable future.
At Gerdau, we routinely monitor the US housing market because historically new home construction has preceded non-residential construction and therefore is an excellent barometer to foresee the likely future demand for construction steel products.