

U.S. Steel Capacity Utilization
U.S. Steel Capacity Utilization: The total tonnage for the week ending February 29th was 1,923 million net tons, at a capacity utilization rate of 82.5%. The first time the capacity utilization has been over 82 percent since the week of January 1st, 2020. The year to date tonnage output is 17,212 million net tons, at an average capacity utilization rate of 82.1%. In 2019, the same output total was 15,180 million net tons, at an average capacity utilization of 80.9%.
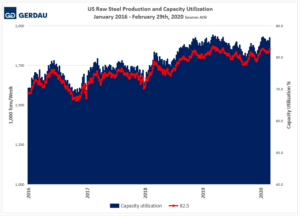
Figure 1 shows production on the left-hand scale and capacity utilization as a percent on the right-hand scale. Capacity utilization and production picked up at the beginning of the year as is typical for January and February.
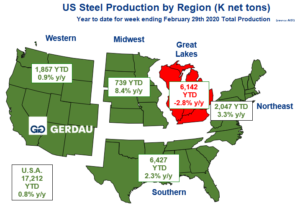
Figure 2 presents a map of the U.S. with its five steel producing zones. The nation as a whole produced 0.8% more steel than for the same period in 2019. The Southern region was the largest steel producing region, with 6,427 million net tons through February 29th, down 2.3% y/y. The Great Lakes region habitually the second largest, produced 6,142 thousand net tons down 2.8% y/y. At 2,047 thousand net tons, the Northwest region ranked third largest. The Midwest tonnage moved up by 0.9% y/y. The Midwest produced 1,857 million net tons, while the Western zone produced 739 thousand net tons, up 8.4% y/y.
At Gerdau, we track US steel production and capacity utilization to keep an eye on the overall health of the US steel industry. We feel it is important to understand the forces that influence steel demand to include the strength of the US economy and import penetration.