

U.S. Steel Capacity Utilization
US steel production averaged 1.733 million (M), tons per week at an average capacity utilization rate of 73.7% year to date (YTD), in 2017. The most recent four week capacity utilization rate was 74.0% at an average production rate of 1.726M tons per week.
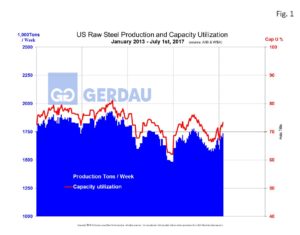 Figure 1 shows production on the left-hand scale and capacity utilization as a percent on the right-hand scale. Production and capacity utilization have been moving steadily higher so far in 2017. Production for the week ending July 1 was 1,717M tons, more than double the low point of 800,000 tons the week of December, 27 2008.
Figure 2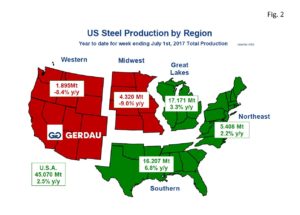 presents a map of the US with the five steel producing zones. The Great Lakes produced the most steel, with 17.171 million tons (Mt), year to date (YTD), up 3.3% y/y. The Southern region produced 16.207 Mt YTD up 6.8% y/y. With 5.408 Mt YTD, the Northeast tonnage increased by 2.2% y/y. The Midwest and Western zones both produced less steel YTD compared to the same timeframe a year ago. The Midwest made 4.320 Mt YTD, off 9.0% y/y, while the West produced 1.964 Mt YTD down 8.4% y/y.
Examining the production statistics on a 3 month moving total (3MMT), y/y basis, presents a different picture. Nationally the 3MMT y/y was down a tick, -0.1%. The Southern zone recorded the highest percentage change with 2,4%, 3MMT y/y, followed by the Western zone, up 2.4%. The Midwest tonnage was stronger by 0.4%, while the Great Lakes (-2.6%) and Northeast (-1.0%) regions each posted declines.
Momentum (3MMT minus 12MMT), was positive in all regions except the Great Lakes (-3.2%). Nationwide momentum was +2.8%. The Midwest had the strongest momentum with 15.0%, followed by the West at 9.9%. The South came-in at 4.0% and the Northeast at 3.1%. Overall the latest capacity utilization report was encouraging trend.
Data from the American Iron and Steel Association (AISI), reports that for the year 2016, 43% of steel shipments went in construction, 27% into automotive applications, 9% into machinery and equipment, 6% into energy projects, 5% into appliances, 4% into containers, 3% into national defense and homeland security and 3% into “other”.
At Gerdau, we track US steel production and capacity utilization to keep an eye on the overall health of the US steel industry. We feel it is important to understand the forces that influence steel demand to include the strength of the US economy and import penetration.