

U.S. Steel Merchant Final Imports
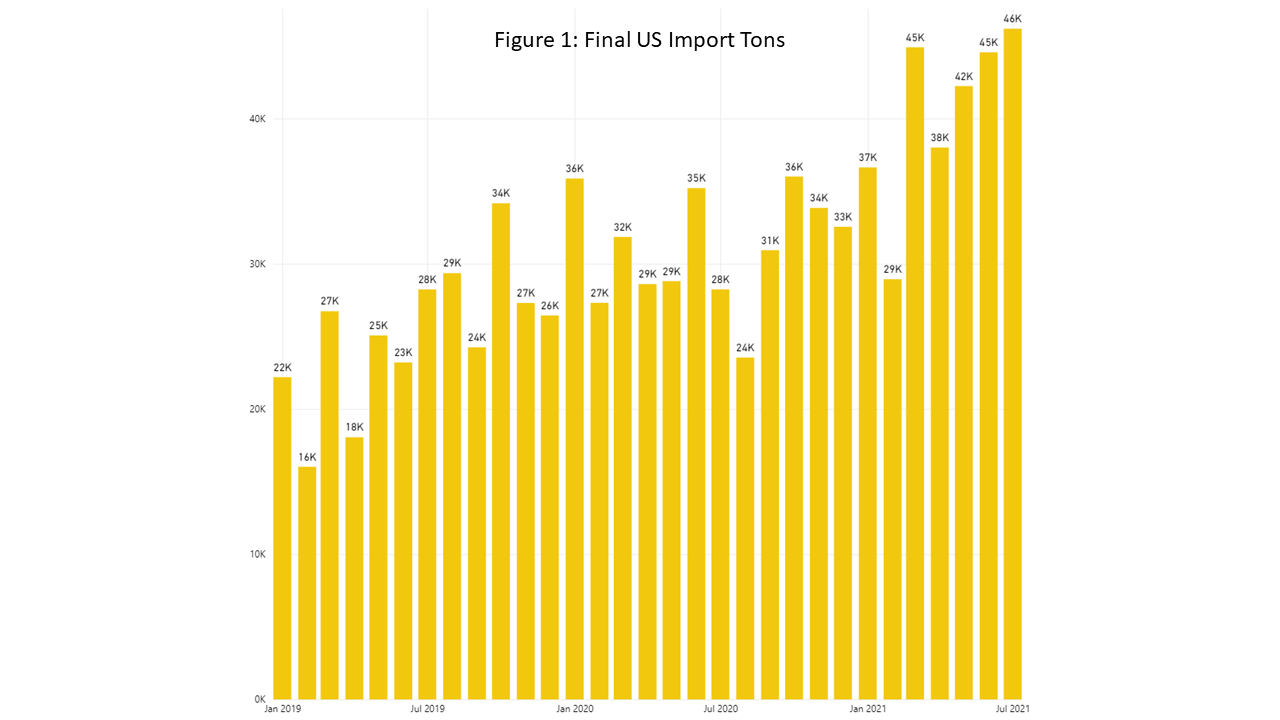
U.S. Steel Merchant Final Imports: Final merchant imports to the U.S. came in at 46,185 tons in July 2021, increasing 4% month over month (m/m).
Figure 1 further breaks down total merchant imports from January 2019 – July 2021. When looking at the current year, we see that imports reached their peak this month, and are at the highest level reported since January 2019.
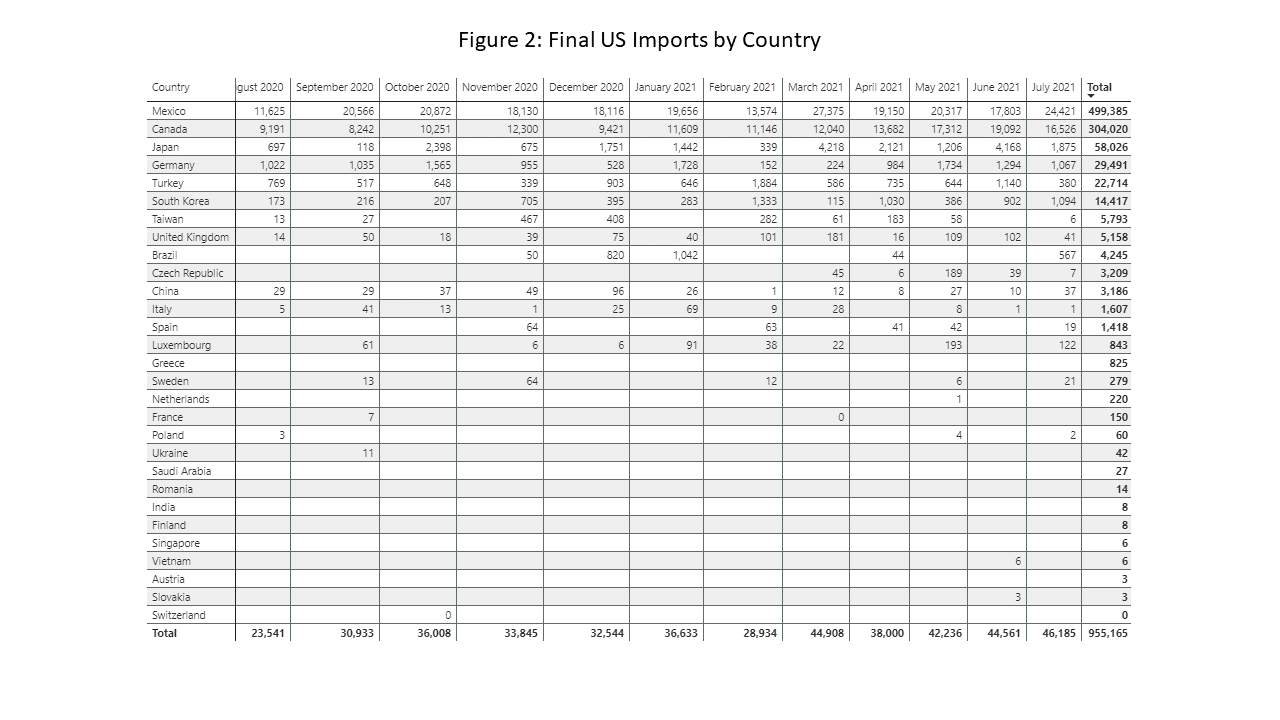
Figure 2 charts the largest exporting countries in rank order through July. Mexico and Canada, combined, account for 89% of the total this month. Mexico was the largest exporter with 24,421 tons; Canadian imports came in at 16,526 tons.
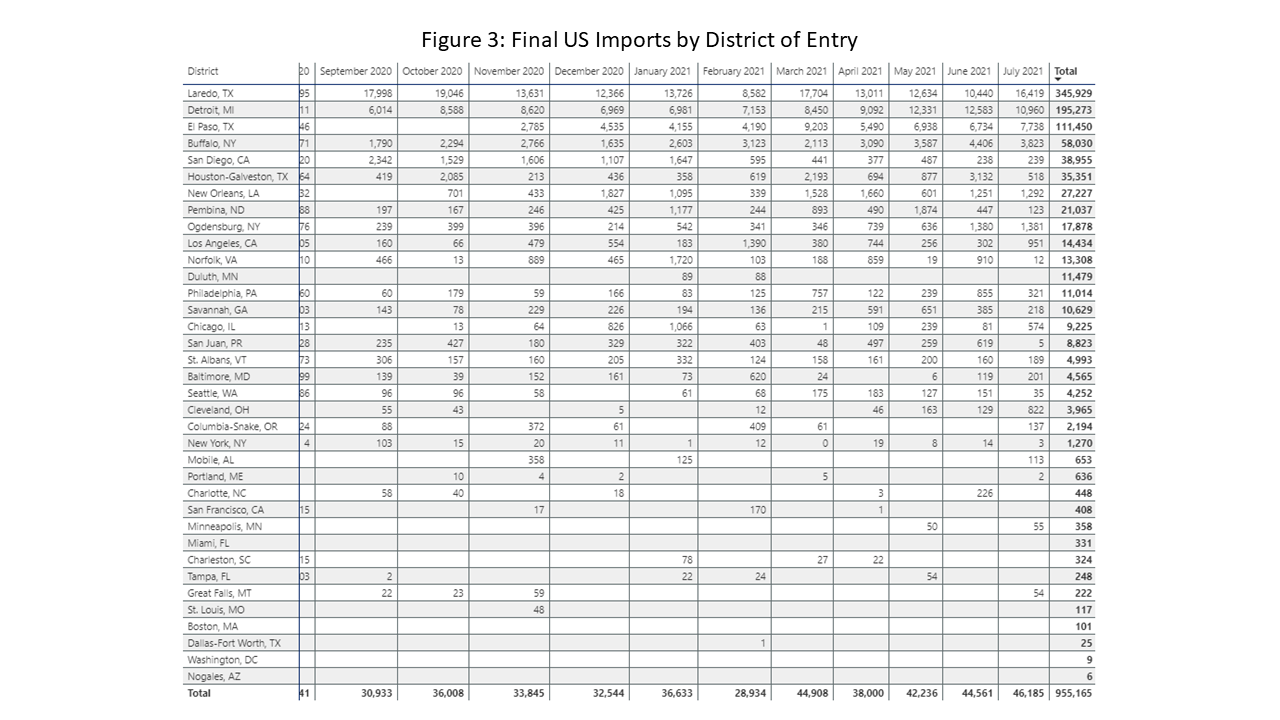
Figure 3 charts the largest imports by district of entry into the U.S. in rank order. Laredo, TX was the largest receiver of merchants this month, receiving 16,419 tons of the total. Detroit, MI was next, coming in at 10,960 tons, while El Paso, TX was the third-largest receiver, coming in at 7,738 tons. Together, these top three receiving ports collected 76% of all U.S. merchant imports.
At Gerdau, we closely follow trade in long product steel since it has a profound impact on domestic market share and material pricing. We want you, our valued customers, to have access to current information that can help you better plan and operate your businesses.