

Architectural Billings Index
Architectural Billings Index: March ABI national overall score of 33.3 was down 20.1 points from February’s 53.4, which is slightly over the expansionary zone, (>50). U.S. architecture firms specializing in commercial and industrial facilities likewise reported a decrease design activity in March, coming on the heels of a significant upturn in February. Firms concentrating in the multifamily either residential or institutional sector reported loses in February.
The new design contracts index increased by 24.9 points to 27.1. Regional monthly scores were South 44.2, West 45.3, Midwest 44.2 and Northeast 38.4.
The Architecture Billings Index (ABI), is a leading economic indicator that provides an approximately nine to twelve-month glimpse into the future of nonresidential construction spending activity. The results are seasonally adjusted to allow for comparison to prior months. Scores above 50 indicate an aggregate increase in billings, and scores below 50 indicating a decline.
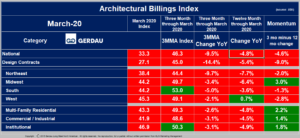
Figure 1 lists the overall ABI and all its sub-indexes. It presents and compares monthly and 3MMA data, showing percentage point change on both three and 12-month basis, as well as momentum. Green denotes positive change, while red indicates negative growth. National momentum, (3-month y/y subtract 12-month y/y) was negative 9.5% while Design contract momentum was negative 14.4%. Regionally, two zones posted negative momentum ranging from 2.1% in the West to 5.0% in the South. Multi-family residential, Commercial / Industrial and Institutional all recorded positive momentum.
At Gerdau we follow the ABI because it is a leading indicator of non-residential construction activity with an approximate 12-month lead-time to ground-breaking. The ABI has a proven track record and as such it is useful for business planning purposes.